Instagram Insights Explained: Reach, Impressions, and Engagement
This in-depth guide to instagram insights explained explains what it is, how it works, and how to use it safely. Reach, impressions, and engagement are the three pillars of Instagram analytics. Every creator hears these terms, but surprisingly few understand exactly what each one measures — or why the difference matters. Confuse them, and you will misread your own data and make bad content decisions. This guide explains all three in depth, how they relate to each other, and how to use them together to grow your account.
Reach: The Number of Unique People Who Saw Your Post
Reach is the count of unique Instagram accounts that saw your content at least once. One person, one count — no matter how many times they viewed it. If your post reached 10,000 accounts, then 10,000 different people saw it.

Reach is the best single measure of your distribution. It answers: how far did Instagram carry this post? Instagram splits reach into followers and non-followers, which tells you whether you are deepening relationships with your existing audience or being introduced to new people. For growth, you want non-follower reach trending upward over time — that means the algorithm is recommending you.
What limits reach? Mostly early engagement. Instagram shows your post to a small test audience first; if those viewers engage quickly (especially with saves, shares, and meaningful watch time), the algorithm expands distribution. Weak early signals keep reach small. This is why the first hour after posting matters so much — and why creators use proven methods to get more Instagram views on every post.
Impressions: The Total Number of Times Your Post Was Shown
Impressions count every display of your post, including repeat views by the same account. If 10,000 unique people saw your post and 3,000 of them saw it twice, your reach is 10,000 and your impressions are 13,000.
Impressions measure exposure volume. They are always equal to or higher than reach — never lower. The ratio between the two is revealing:
- Impressions ≈ reach: Most people saw your post once. This is normal and healthy for feed posts.
- Impressions moderately higher than reach: A good chunk of viewers came back. Your content has replay value — common with tutorials, infographics, and entertaining Reels.
- Impressions far higher than reach: Your post is being revisited heavily or shown repeatedly. This can indicate viral looping (great for Reels) or, occasionally, that the same small audience keeps seeing it.
Instagram also breaks impressions down by source — Home, Profile, Explore, Hashtags, and Other. This is strategically crucial: it tells you where your distribution came from, so you know which discovery channels to optimize.
Engagement: Every Way People Interacted
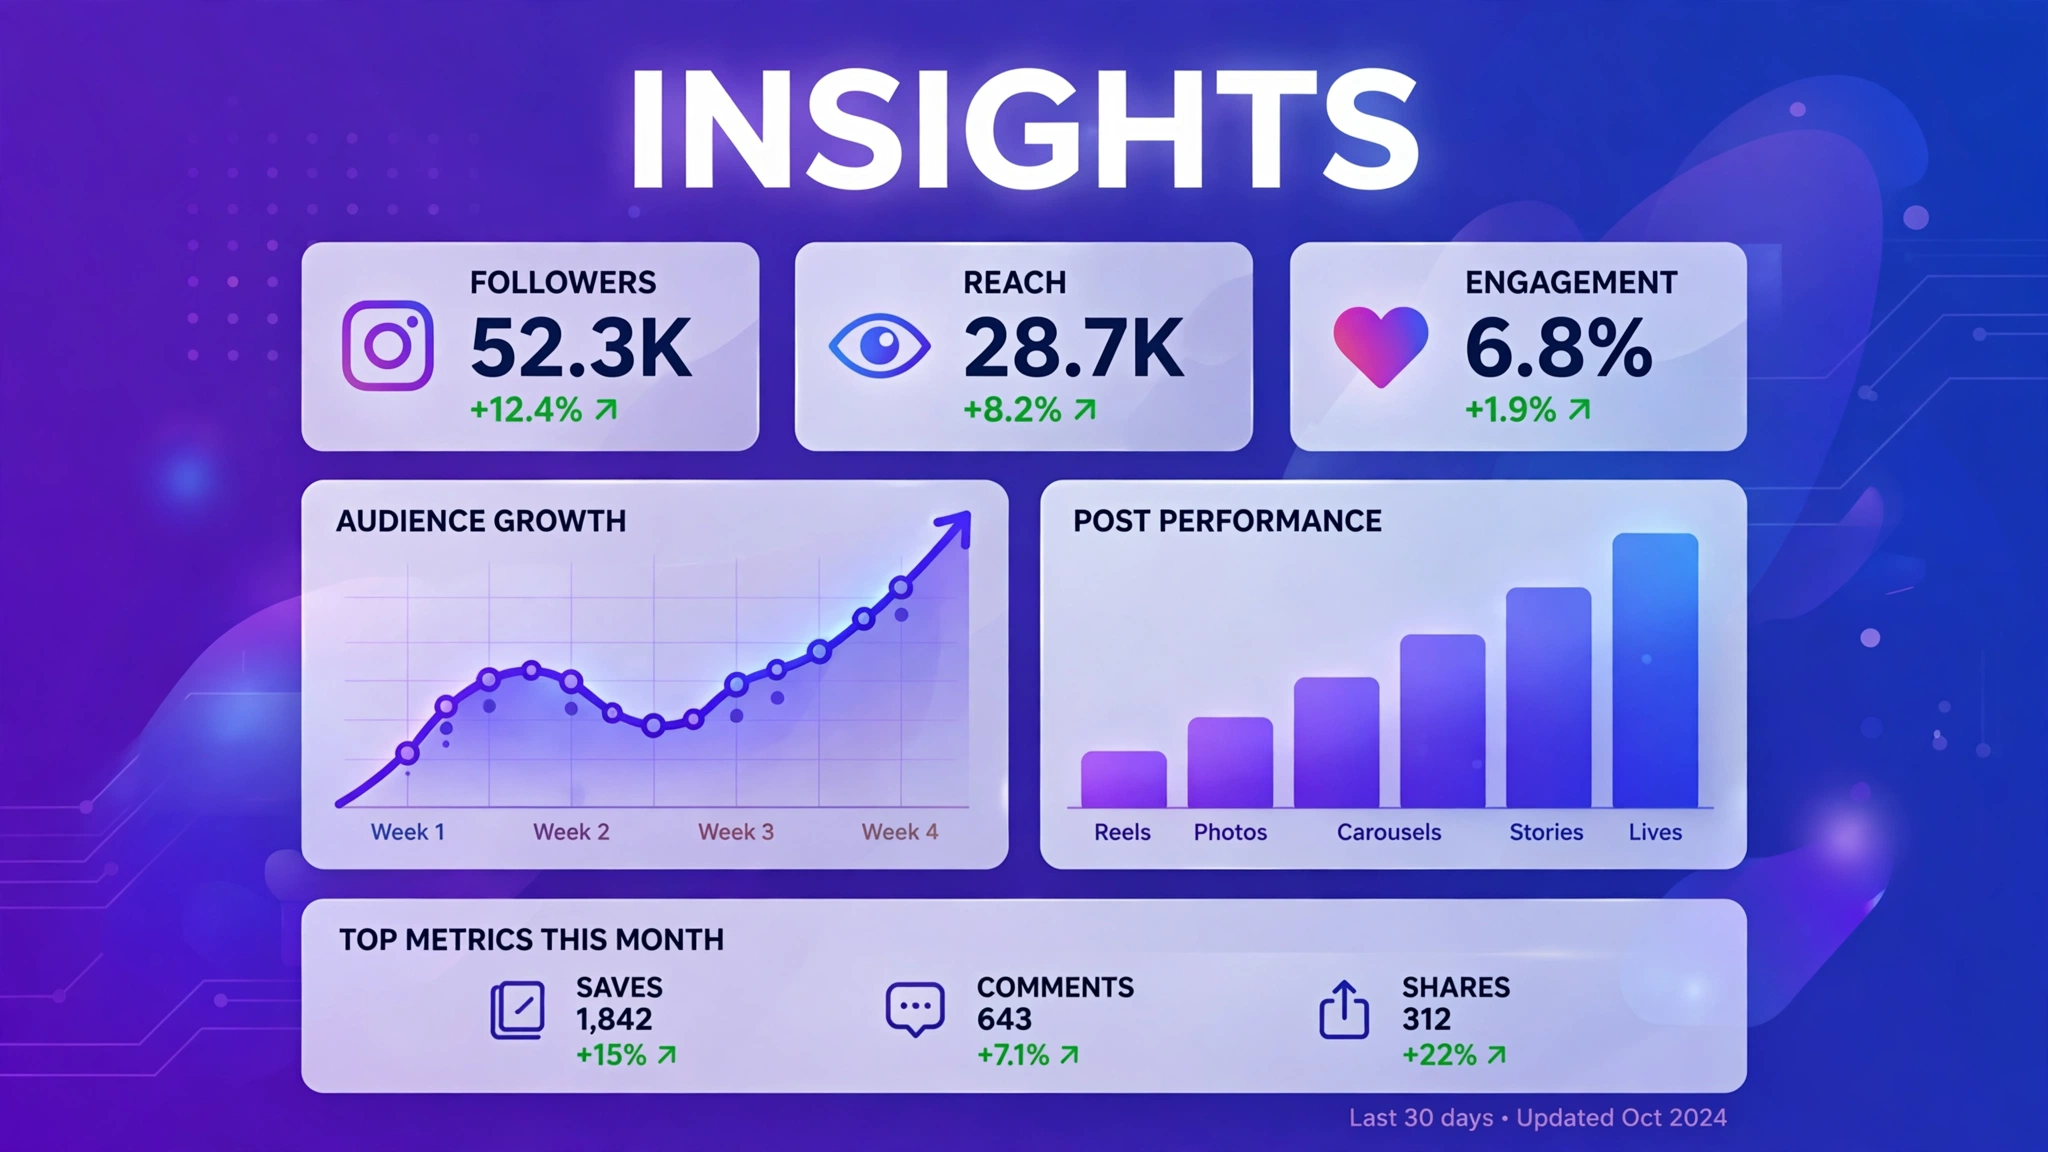
Engagement is the umbrella term for all active interactions: likes, comments, shares (sends), saves, and on Reels, extended watch time. While reach measures who saw your content, engagement measures who cared enough to act.
Not all engagement is equal. Instagram’s ranking systems weigh interactions roughly like this, from strongest to weakest signal:
- Saves — someone wants to revisit your content later. The strongest quality signal.
- Shares — someone sent it to a friend. Powerful distribution signal.
- Comments — conversation takes effort and keeps people on the post longer.
- Profile visits and follows — the viewer wants more of you specifically.
- Likes — quick approval, but the weakest signal of the group.
This hierarchy is why a post with 500 likes and 200 saves will often outrank a post with 2,000 likes and 10 saves. When you read your insights, always look at the composition of engagement, not just the total.
Engagement Rate: The Metric That Puts It All Together
Engagement rate combines reach and engagement into one comparable number. The most common formula is:
Engagement rate = (total interactions ÷ reach) × 100
For example, if your post reached 5,000 accounts and earned 250 total interactions (likes + comments + shares + saves), your engagement rate is 5%. This percentage lets you compare posts fairly regardless of audience size — a small account and a large account can both have a 5% engagement rate.
What counts as good? It varies by niche and account size, but general benchmarks are: 1–3% is typical, 3–6% is strong, and above 6% is excellent. Smaller accounts often see higher rates because their audiences are more loyal; mega-accounts typically sit at the lower end. Always benchmark against your own history first.
How the Three Metrics Work Together
Here is how to read them as a system rather than in isolation:
- High reach + high engagement: Your best-case scenario. The algorithm distributed your post widely and people loved it. Study this post and replicate its formula.
- High reach + low engagement: Distribution worked but content did not resonate. The hook, topic, or execution missed. Fix the content, not the distribution.
- Low reach + high engagement: Great content that Instagram did not distribute. Often a timing, format, or early-engagement issue. Try reposting a variation at a better time.
- Low reach + low engagement: The post missed on both fronts. Treat it as a learning data point and move on — every creator has these.
This four-quadrant reading is the fastest way to diagnose any post in under a minute.
How to Improve Each Metric
To improve reach, focus on the first hour: post when your audience is most active (check your audience insights for active times), use a strong hook in the first line or first second, and choose formats Instagram currently favors, like Reels. These IG tools for Reels growth can help you produce Reels engineered for wider distribution. To improve impressions per viewer, create saveable and rewatchable content — tutorials, lists, before-and-afters, and satisfying loops. To improve engagement, end captions with a genuine question, create content worth sharing with a friend, and pack in practical value worth saving — this detailed guide on how to improve your Instagram engagement rate covers the full playbook.
Remember that these metrics feed each other in a loop: better engagement earns wider reach, wider reach brings more impressions, and more impressions create more chances for engagement. Improving any one of them lifts the others over time.
Frequently Asked Questions About Instagram Insights Explained
What is the difference between reach and impressions in one sentence?
Reach counts unique people who saw your post; impressions count total views including repeats by the same people.
Which is more important: reach or engagement?
Both matter, but engagement quality usually matters more. Meta’s official business resources consistently emphasize meaningful interactions as the foundation of distribution. High engagement earns algorithmic distribution, which produces reach. Chasing reach without engagement leads to hollow numbers that do not grow your account.
How do I calculate my Instagram engagement rate?
Add up your post’s likes, comments, shares, and saves, divide by reach, and multiply by 100. For example, 300 interactions ÷ 6,000 reach × 100 = 5% engagement rate.
Why did my reach suddenly drop?
Common causes include weaker early engagement on recent posts, posting at low-activity times, reduced posting consistency, or a format shift your audience did not respond to. Compare your last few posts’ engagement mixes to find the pattern.
Do paid promotions change how I should read these metrics?
Yes — separate organic from paid. Instagram labels paid reach in insights. Judge your content strategy on organic numbers; use paid numbers only to evaluate ad performance.
What is the most important thing to know about instagram insights explained?
The most important thing about instagram insights explained is to stick to safe, legitimate methods and never share your Instagram password with any third-party site. Whether you are exploring instagram insights explained for growth, analytics, or simple curiosity, prefer official Instagram features and Meta-approved tools, and treat any service promising instant or guaranteed results with healthy skepticism.